

 Table of Content
Business intelligence is a must-have tool rather than a nice-to-have. Every business deals with website data, sales data, marketing data, financial data, and even customer service data on a daily basis. However, it makes sense only when you make informed decisions based on this data. And here comes the role of BI solutions.
Good BI tools let you pull data from multiple sources, build dashboards, and spot trends visually. The point is fewer blind spots - you're watching the metrics that actually matter and deciding faster because of it. Regardless of the size of your business, BI software can be helpful for you.
In this guide, we've reviewed the top Business Intelligence (BI) tools in 2026 based on ease of us, AI features, and overall value. By the end of this article, you will be able to determine which business intelligence product is the best fit for your company.
What Is a Business Intelligence Tool?
A business intelligence (BI) tool pulls data from your systems - sales, finance, ops, whatever - and turns it into something you can actually read: dashboards, reports, charts. The point is skipping the spreadsheet archaeology and seeing what's happening in the business without digging for it.
Most BI tools do three things: pull in your data, clean it up, then turn it into charts so patterns jump out instead of hiding in rows of numbers. Tableau, Power BI, Looker- that kind of thing.
★ Worth remembering: A BI tool is only as useful as the questions someone asks it. Great dashboards, no follow-up questions - you've built expensive wallpaper.
How BI Tools Actually Work
It pulls data from wherever it's scattered and dumps it into one place as reports and dashboards. No more stitching spreadsheets together by hand or writing a query every time you need a number - the software just does it, updated in real time.
Here's how most BI tools work:
- Connecting with data sources: When we talk about business intelligence tools we are talking about software that connects with data sources. These business intelligence tools pull data from lots of places like databases and cloud apps and customer relationship management systems and enterprise resource planning systems
- Clean and Organize Data: Next teams can share what they have found out with each other. They can share reports. Set up automatic updates and work together using the same data.
- Analyze Information: Built-in analytics identify patterns, trends, and key performance metrics across your business.
Modern business intelligence platforms are really cool because they use intelligence to help you understand your data better. They can look at your data. Find patterns predict what might happen next and even find things that do not seem right. You can also ask these platforms questions in language like you were talking to a person. This makes it a lot faster and easier for anyone to look at data even if they are not very technical.
We covered a related wave of tools in our generative AI data analytics tools roundup, several of which overlap with the platforms below.
11 Business Intelligence Tools Worth Using in 2026
1. Sisense - Best for embedding analytics into your own product
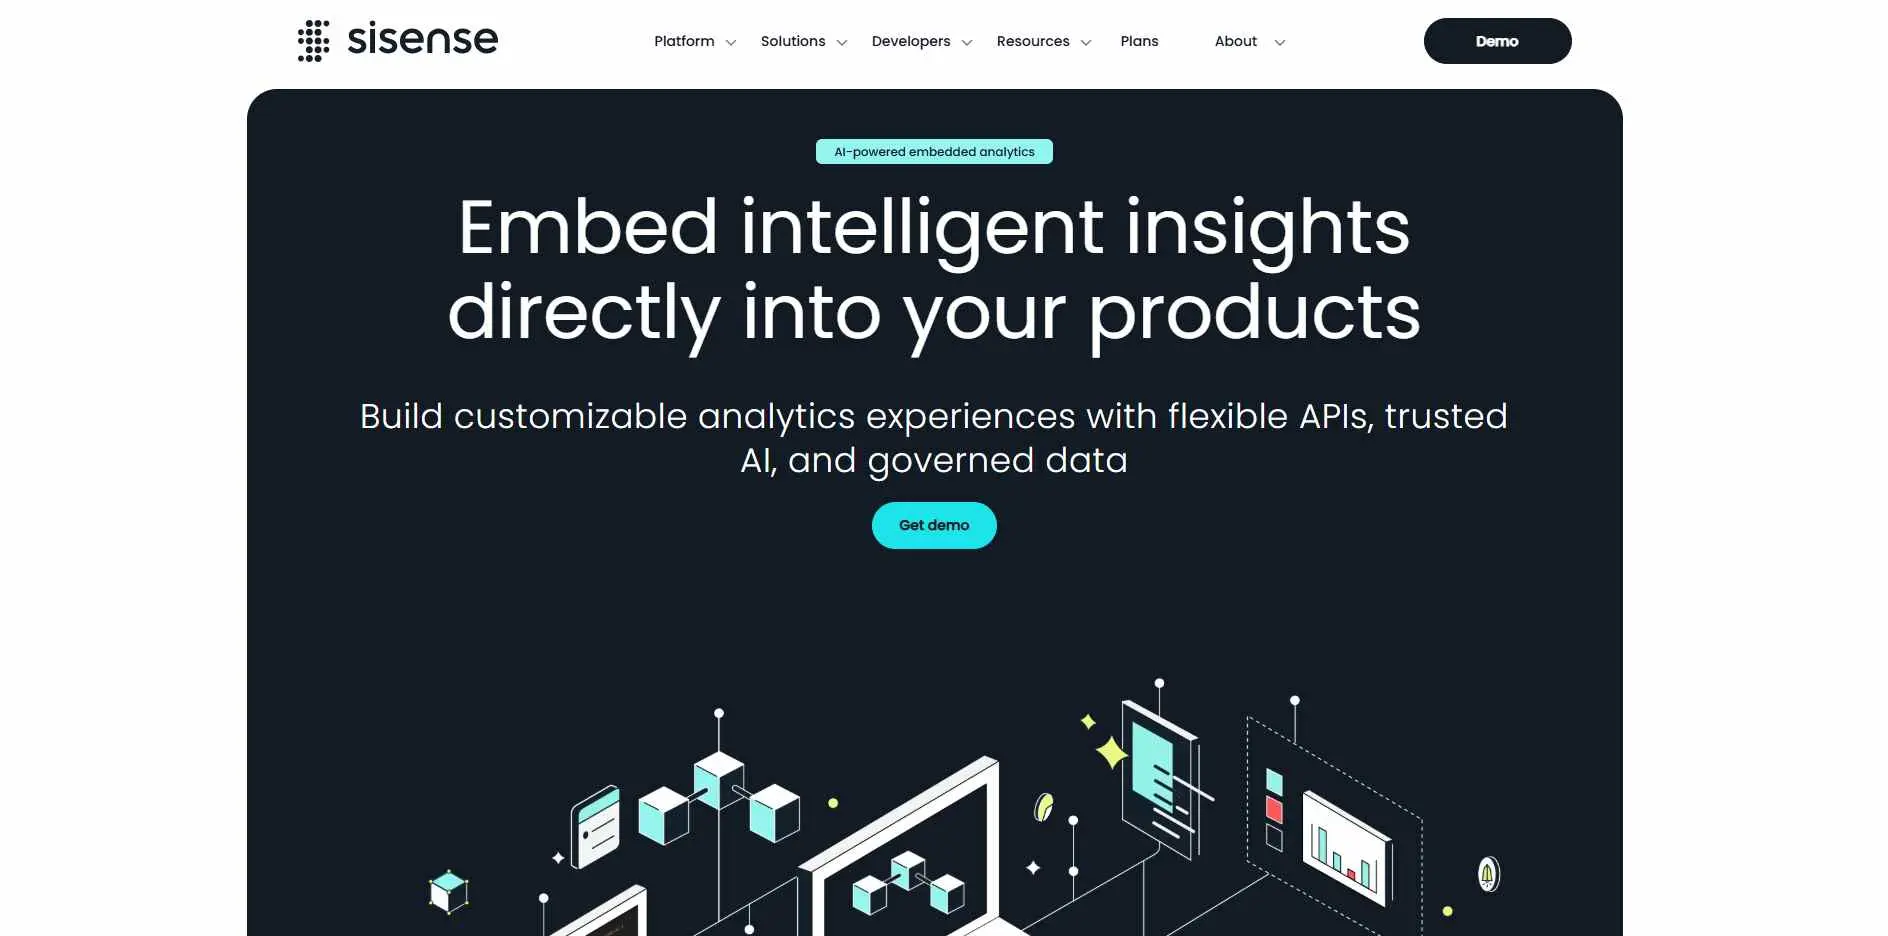
Sisense is an artificial intelligence BI solution which assists companies in connecting data, creating interactive dashboards and embedding analytics in various applications.
Key features:
- embedded analytics SDK
- handles large datasets without heavy IT lift
- strong third-party integration library
THE CATCH: embedding is the real strength here - for a purely internal dashboard, you're paying for capability you won't touch.
Best for: SaaS companies embedding analytics into a customer-facing product.
2. Spotfire - Best for predictive, data-intensive industries
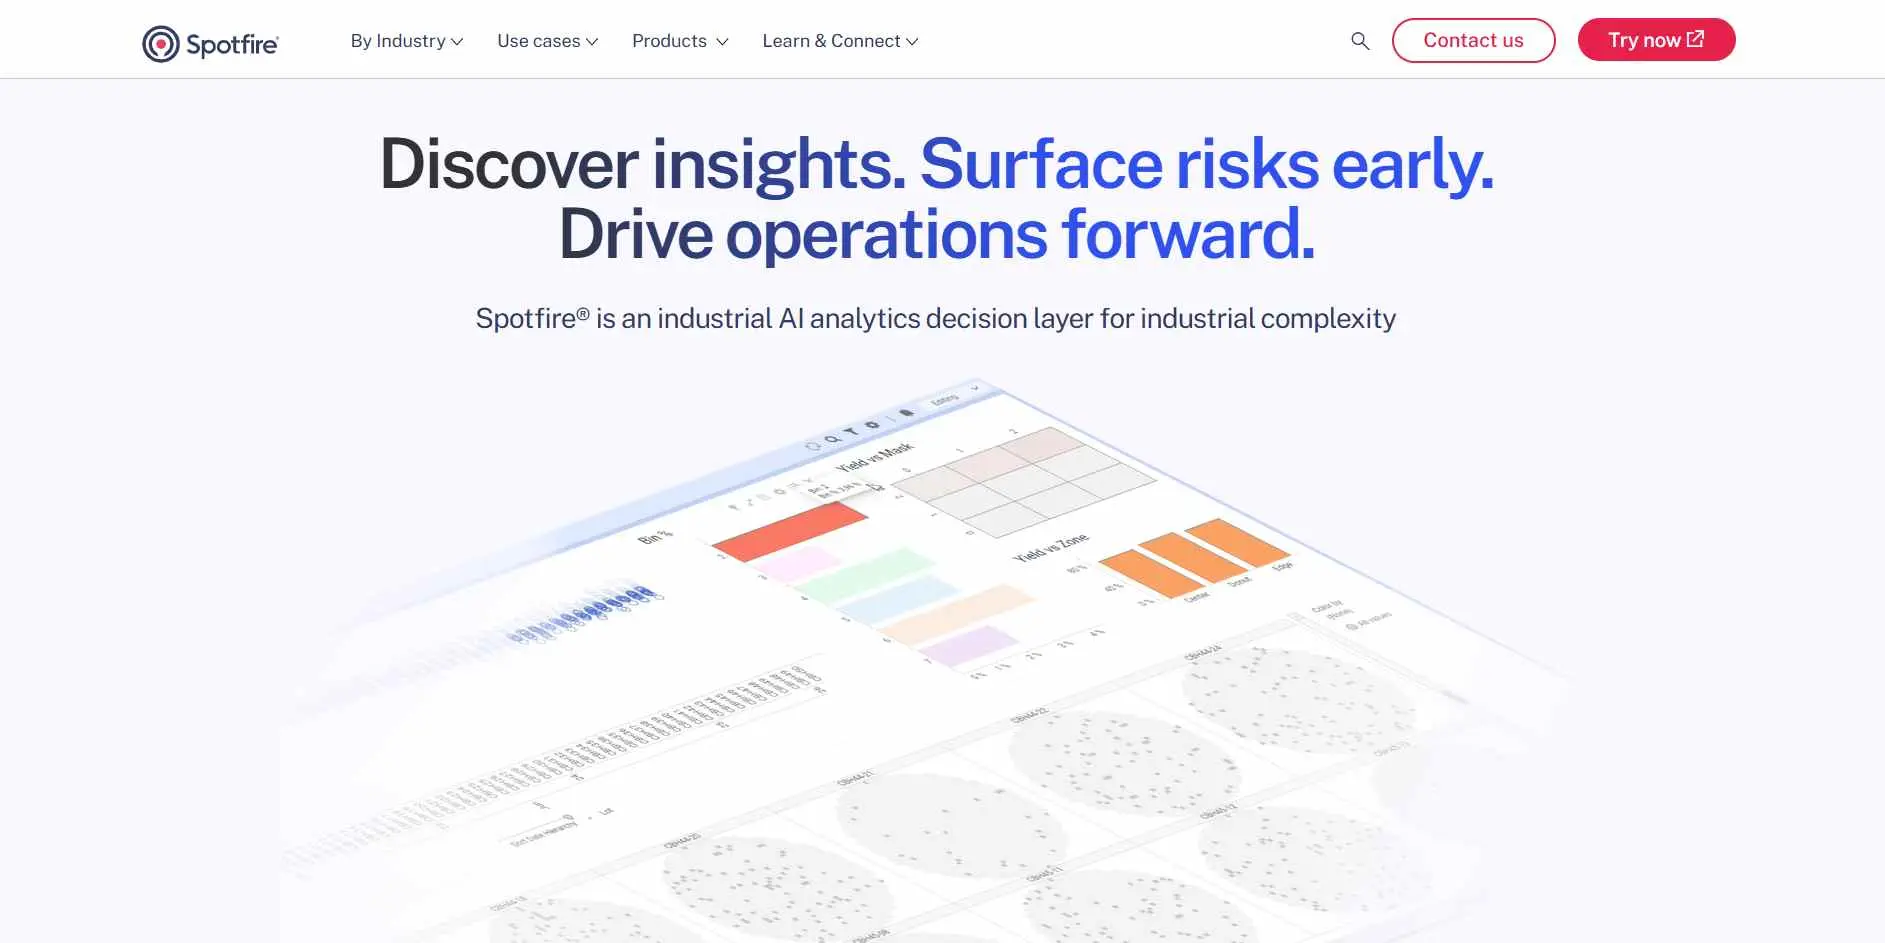
Spotfire is a business intelligence platform that is used for analytics and interactive dashboards and artificial intelligence insights. It helps organizations look at data and make good business decisions faster. Business intelligence tools like Spotfire are very useful for businesses.
Key features:
- built-in predictive modeling
- real-time streaming analysis
- strong fit for scientific and industrial data.
Worth knowing: the learning curve is steep next to drag-and-drop tools like Power BI - built for analysts, not casual viewers.
Best for: Data-intensive industries needing predictive analysis, not just reporting.
3. Clear Analytics - Best for teams that live in Excel
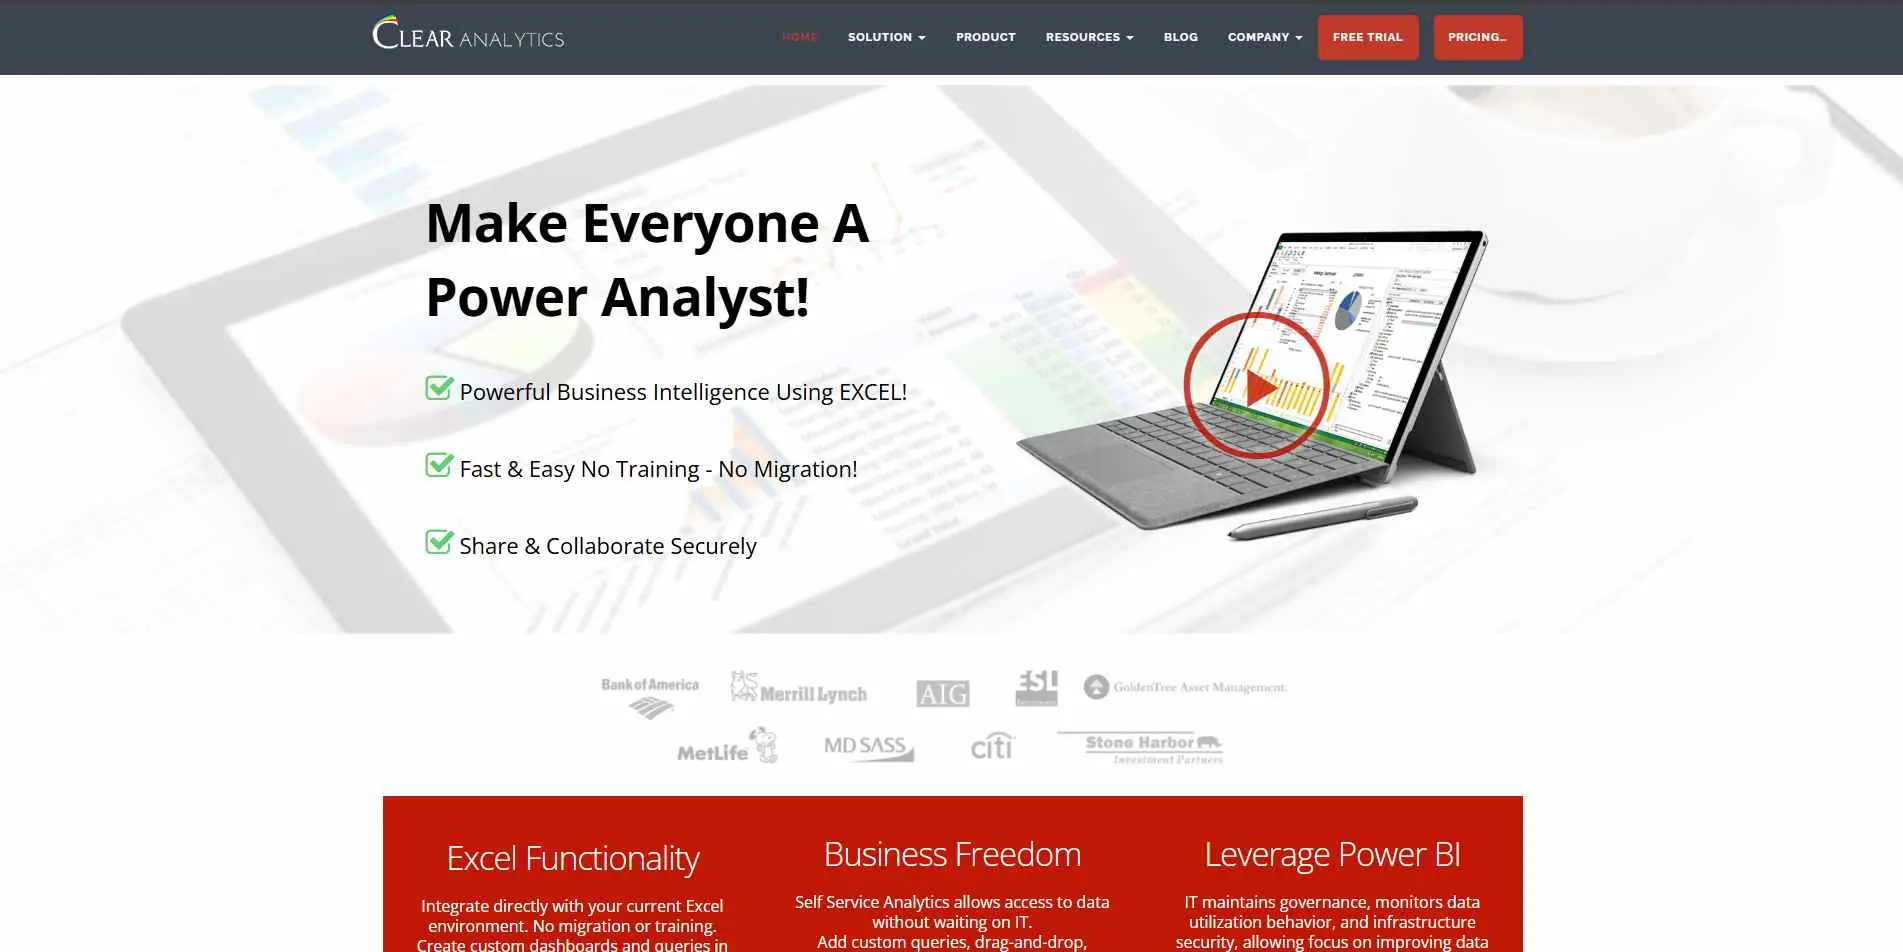
Clear Analytics is a tool that works with Excel to help with reporting and analyzing data. It is also good at creating dashboards. This is ideal for teams that really like using Microsoft Excel.
Key features:
- native Excel add-in
- self-service reporting and data modeling
- integrates with Power BI
THE CATCH: it's genuinely limited outside Excel-heavy workflows - a spreadsheet-first culture is what makes this worth it.
Best for: Finance and ops teams who don't want to leave Excel.
4. Tableau - Best for pure data visualization
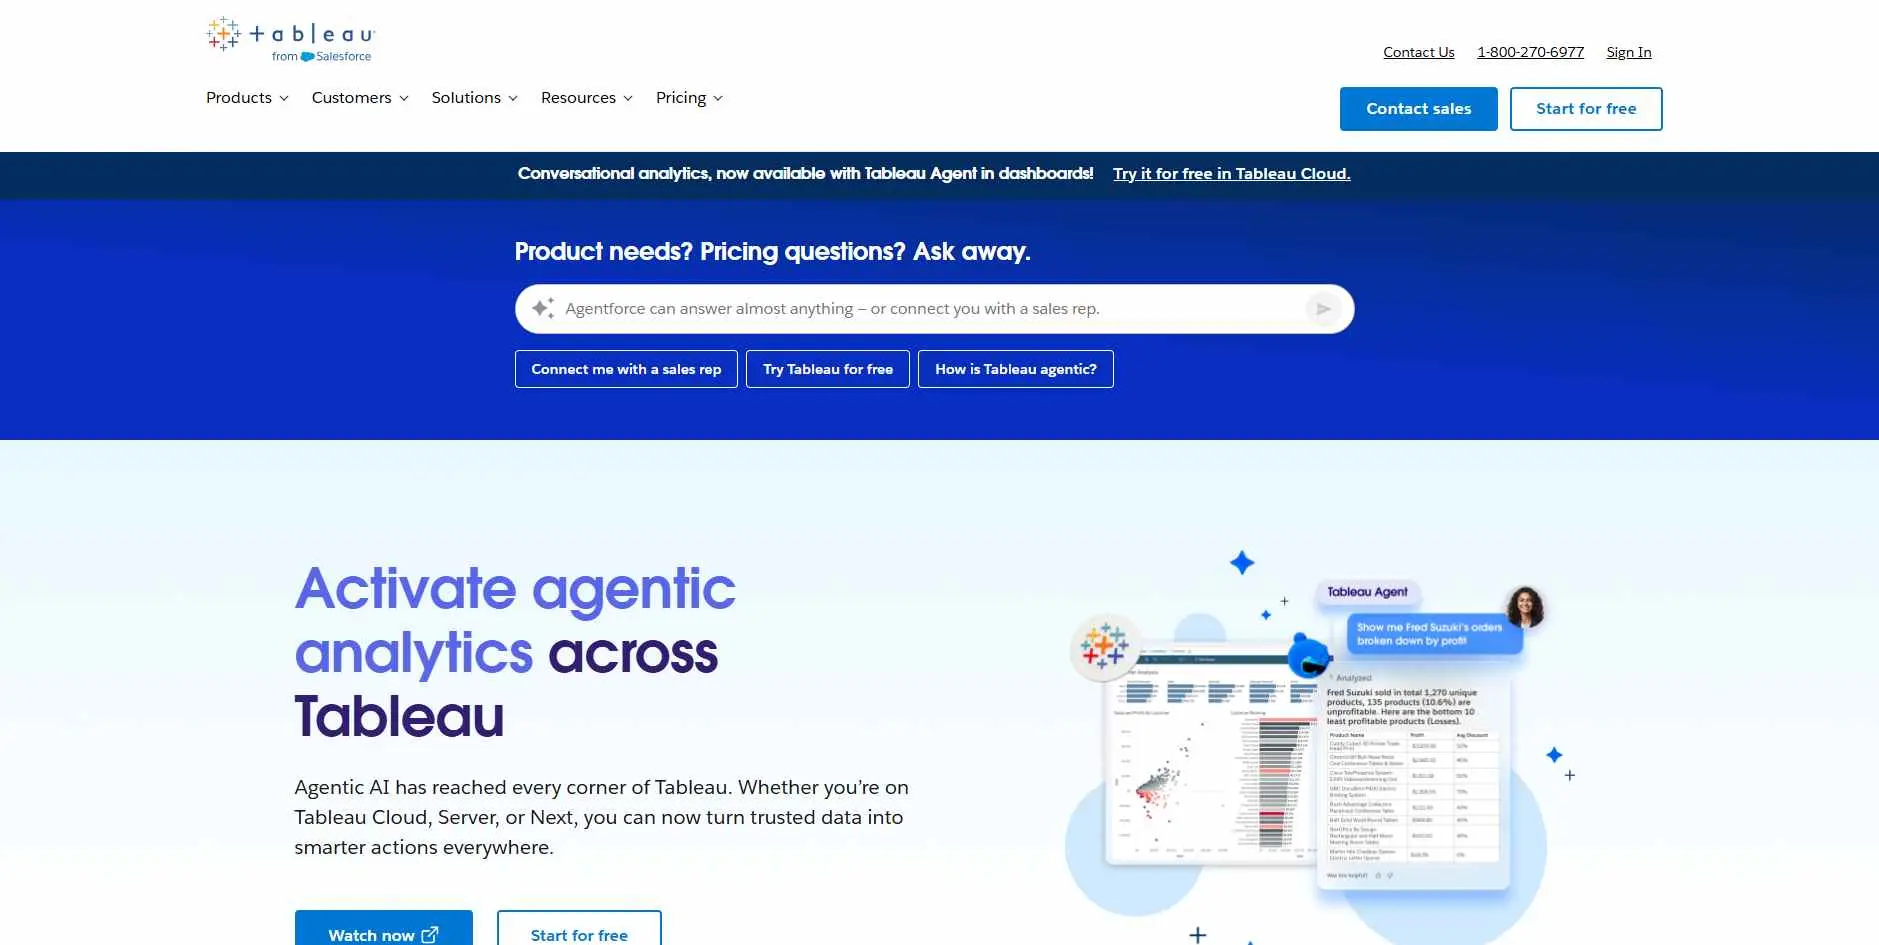
Tableau is a tool that helps people connect their data and build interactive dashboards. They can also create reports that're easy to look at. It makes analyzing business data simple for every team.
Key features:
- deep visualization library
- multi-cloud deployment across AWS/GCP/Azure
- embedded analytics for publishing elsewhere
Fair warning: it's read-only by design. No CRUD, no write-back - anything beyond charts needs a separate tool, and pricing draws consistent complaints relative to the value.
Best for: Analytics teams whose job stops at looking into and presenting data.
5. Domo - Best for blending cloud data sources fast
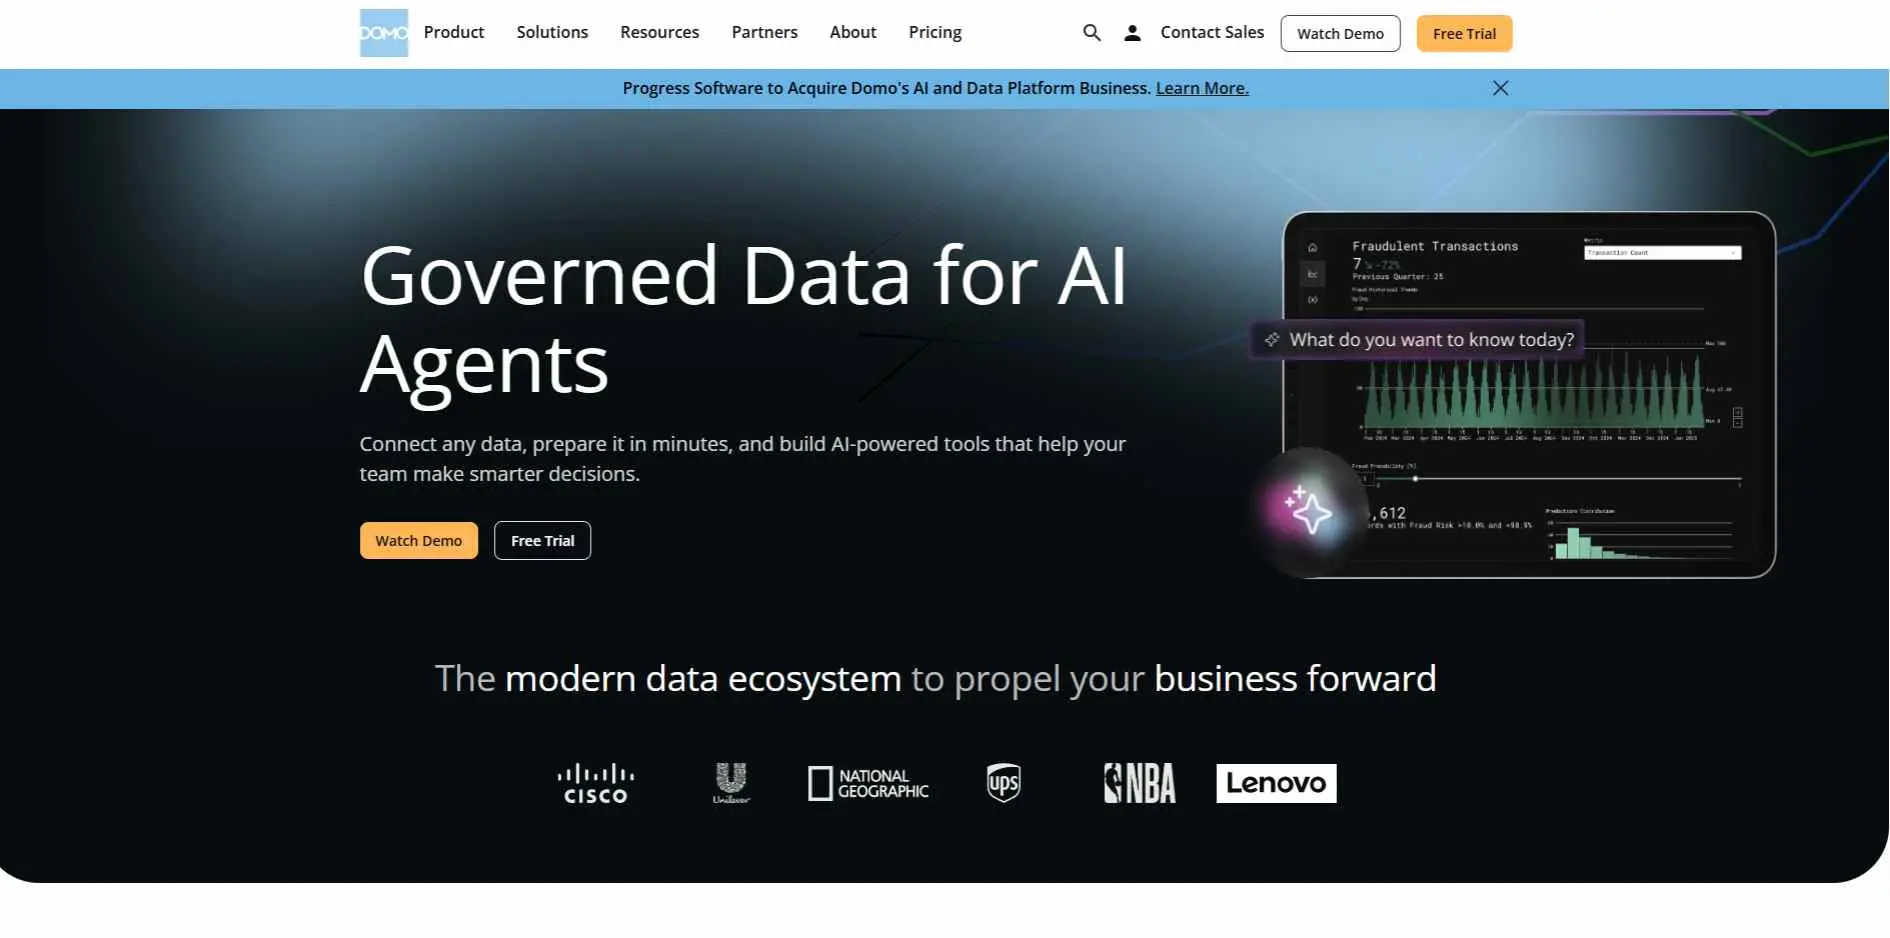
Domo is a cloud-based tool that connects all the business data. It creates dashboards in time and helps teams keep an eye on how they are doing. They can do this with reports and special analytics that use artificial intelligence and can do all of this from anywhere.
Key features:
- broad pre-built connector library, AI-powered insights, mobile-first dashboards.
THE CATCH: the curve is steeper than the marketing suggests once you move past basic dashboards into Domo's own scripting layer (Beast Mode).
Best for: Teams that need dashboards live fast across many cloud sources.
6. Metabase - Best free, open-source option
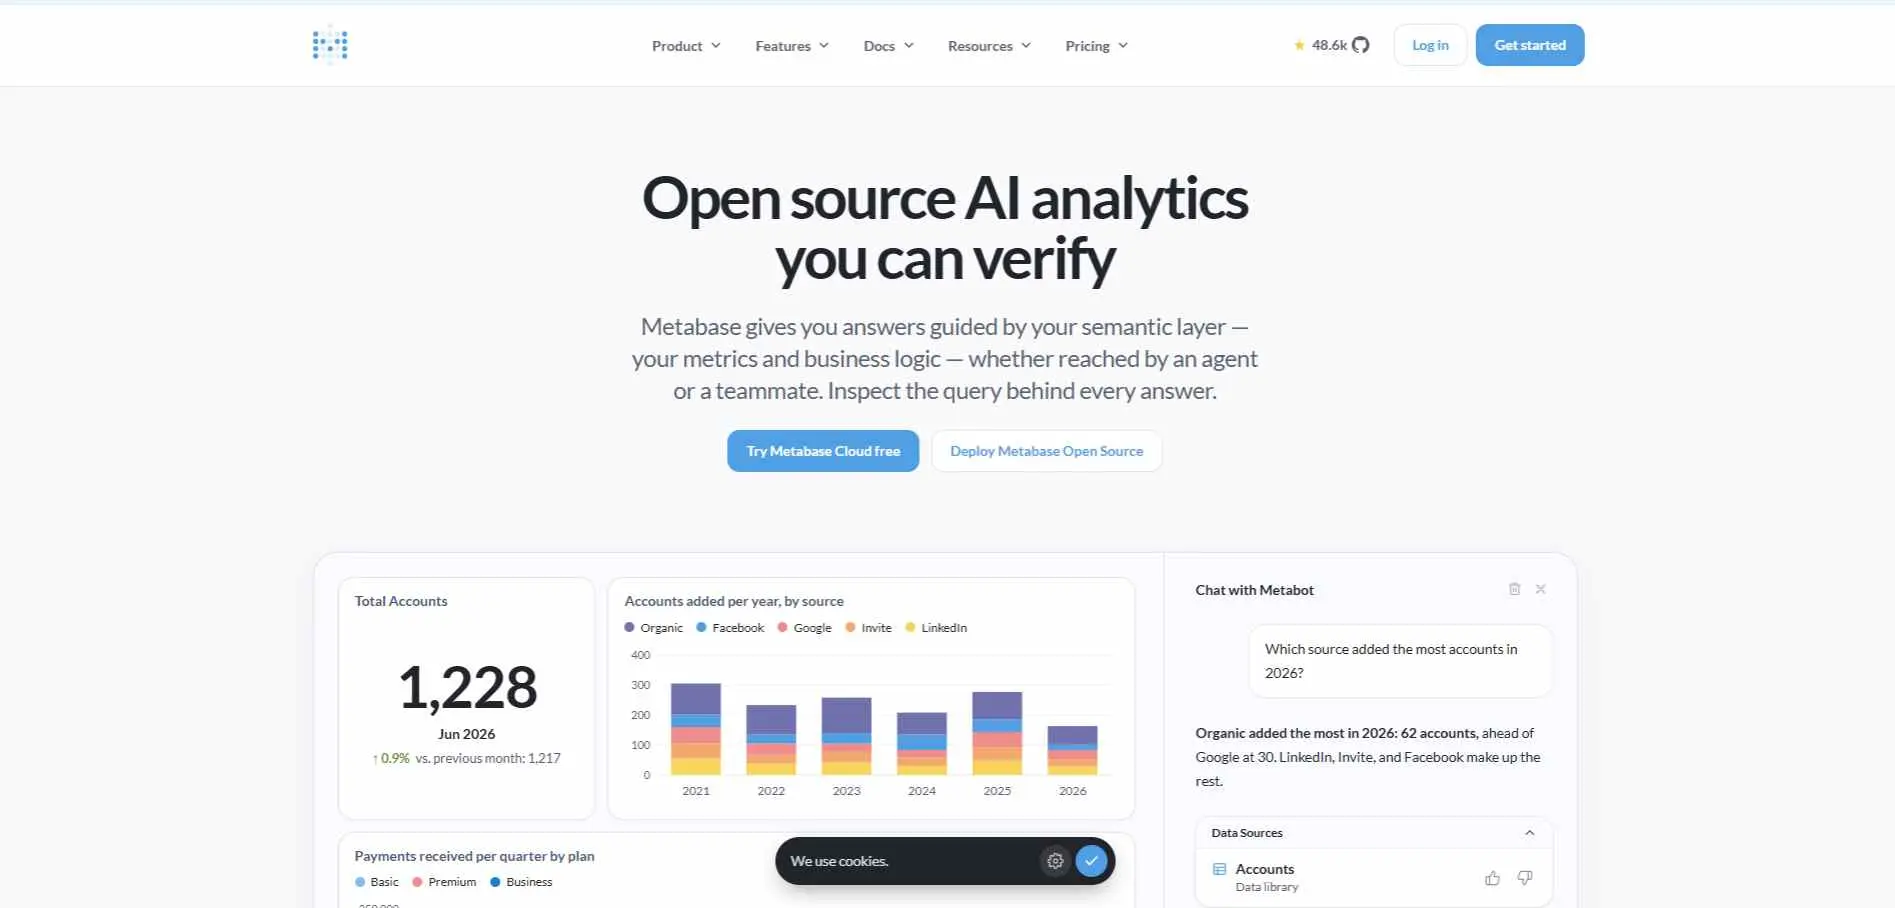
Metabase is an open-source business intelligence solution that allows exploring, analyzing data, creating dashboards and reports without being technically advanced. This tool will be handy for rapidly developing businesses.
Key features
- Free open-source core together with a paid hosted Cloud, a simple query tool, full self-hosting capabilities.
Best for: Startups and small teams wanting real BI without a big budget.
7. Redash - Best for SQL-first teams sharing queries
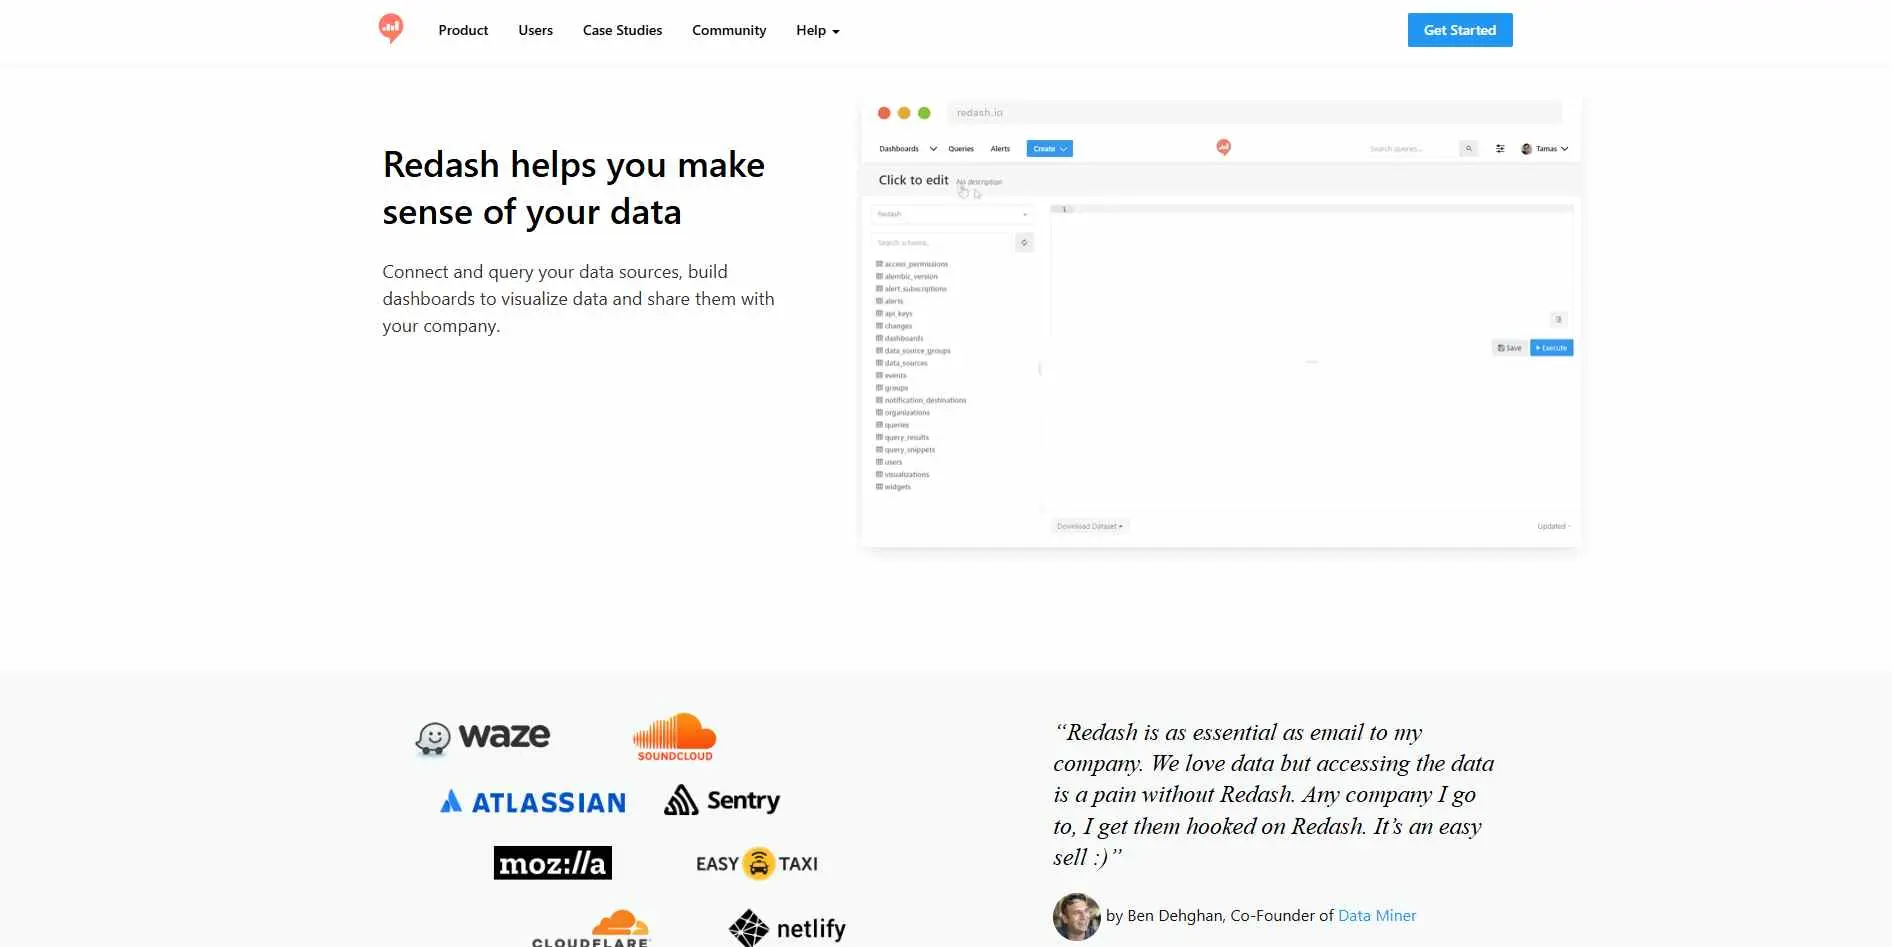
Redash is an open-source business intelligence platform that helps teams query databases, visualize data, and share interactive dashboards. It is a good choice for SQL users and developers.
Key features:
- query-first workflow across dozens of databases
- lightweight dashboards from SQL results
- open-source with a hosted option
Best for: Engineering-heavy teams that already think in SQL.
8. Databricks - Best for BI on top of a data lakehouse
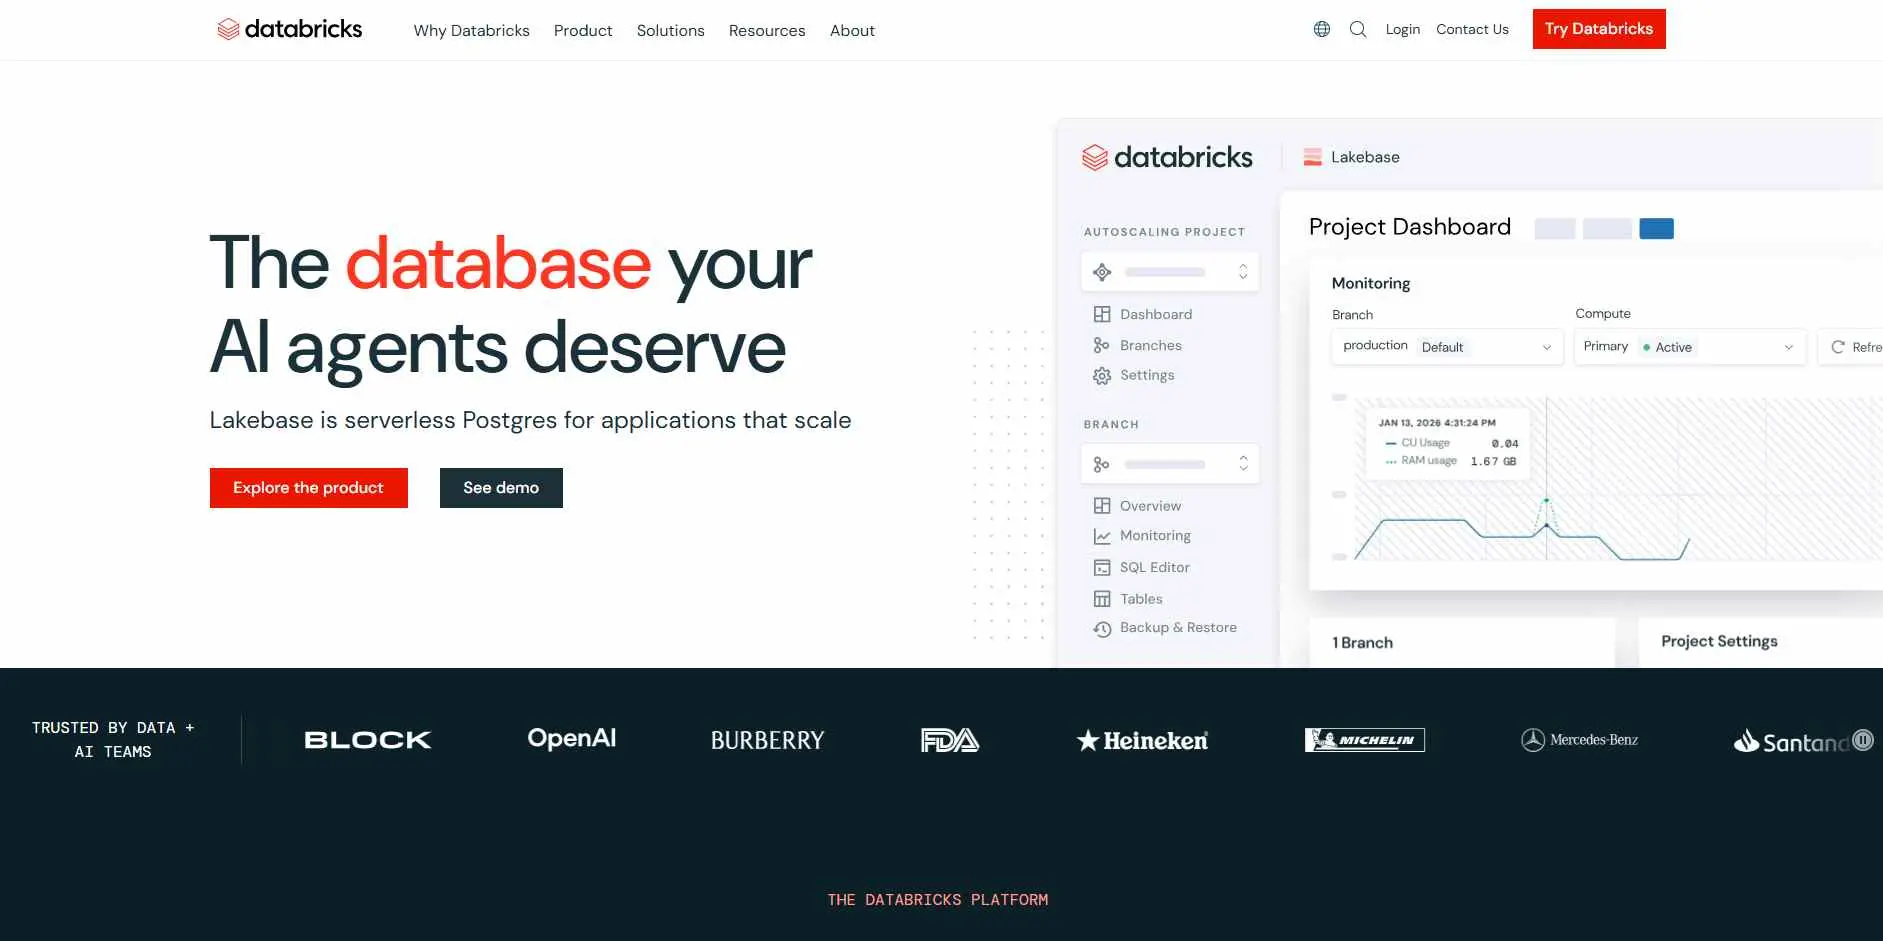
Databricks is a combination of data engineering, artificial intelligence and BI solution which allows for analyzing big data sets and building dashboards using AI analytics.
Key features:
- BI and AI/ML workloads on the same platform
- natural-language querying via AI/BI Genie
- no data duplication into a separate warehouse
Worth knowing: overkill without an existing data engineering team - built for serious data pipelines, not a five-person marketing team.
Best for: Data teams already on Databricks who want BI without duplicating data.
9. ThoughtSpot - Best for search-driven analytics
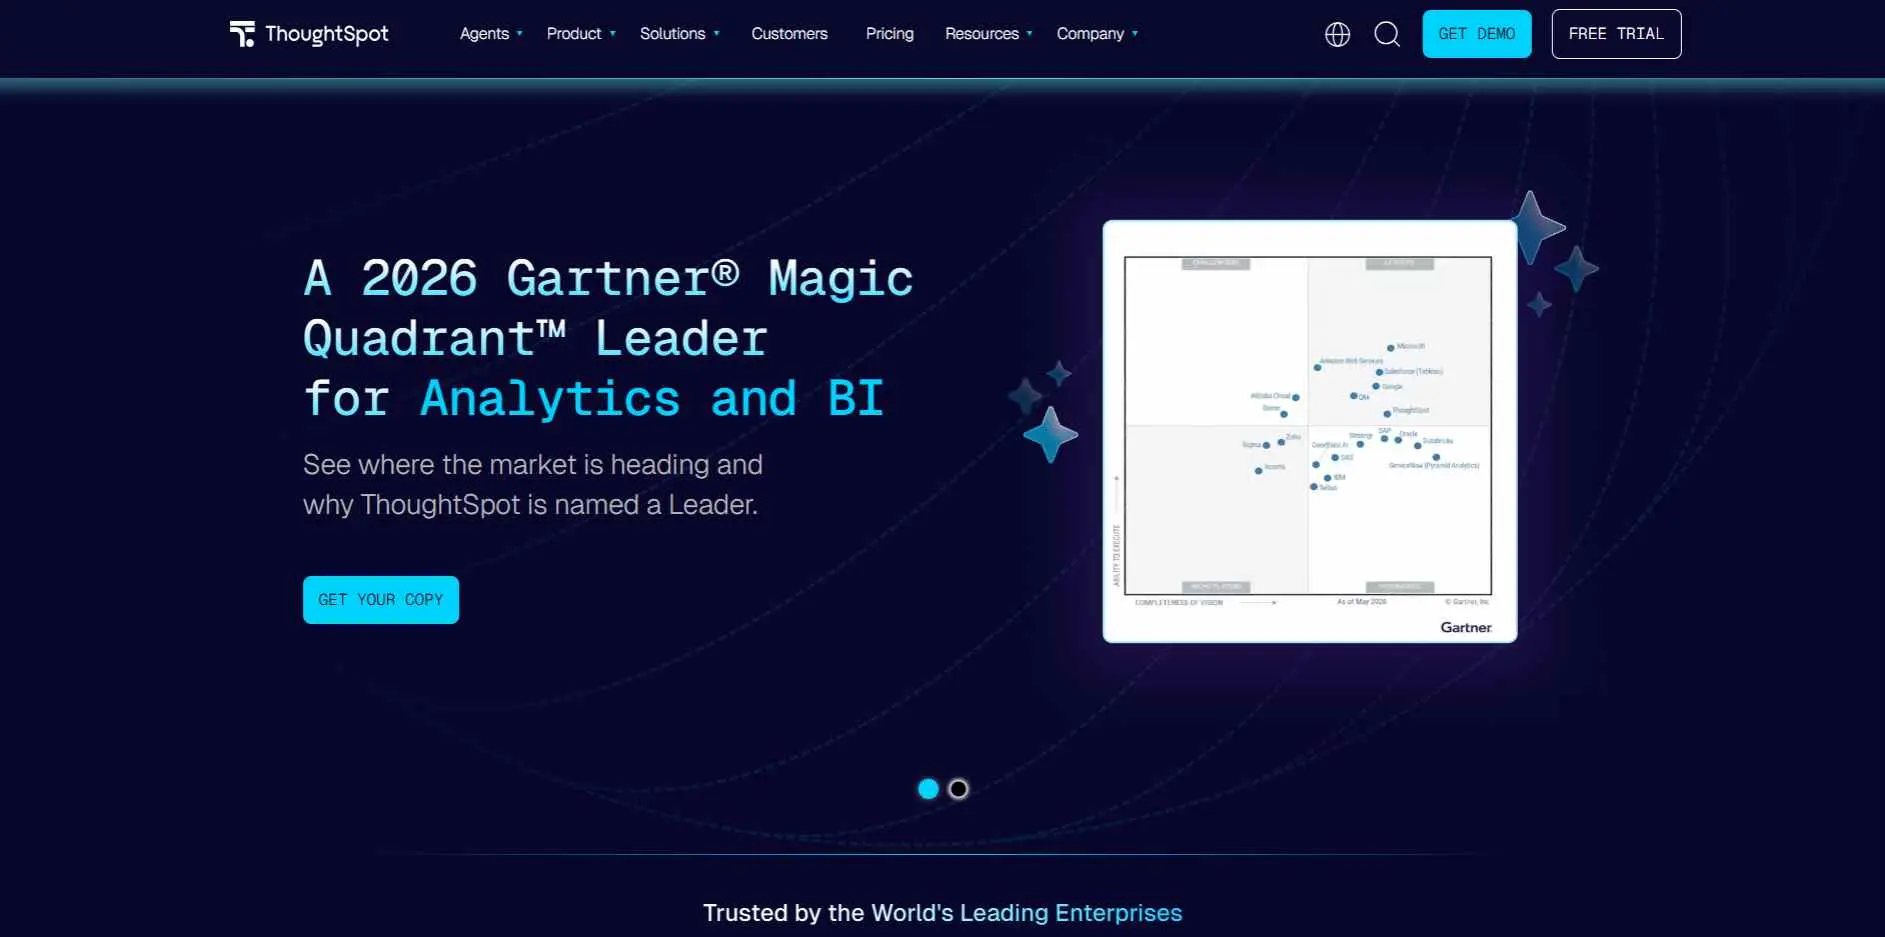
ThoughtSpot is a tool that uses artificial intelligence to help people understand their business data. It is like a search engine for your data. You can ask it questions. It will help you find the answers you need. ThoughtSpot lets you build dashboards and get insights from your data without having to deal with reports. You can just search through your data in a way that feels natural like you were asking a question out loud. You can use ThoughtSpot to get insights from your data and create dashboards with ThoughtSpot.
Key features:
- Natural-language search as the primary interface
- AI-generated insights surfaced automatically
- embeddable into other apps
Best for: Business users who'd rather type a question than build a dashboard.
10. Incorta - Best for skipping traditional data warehousing
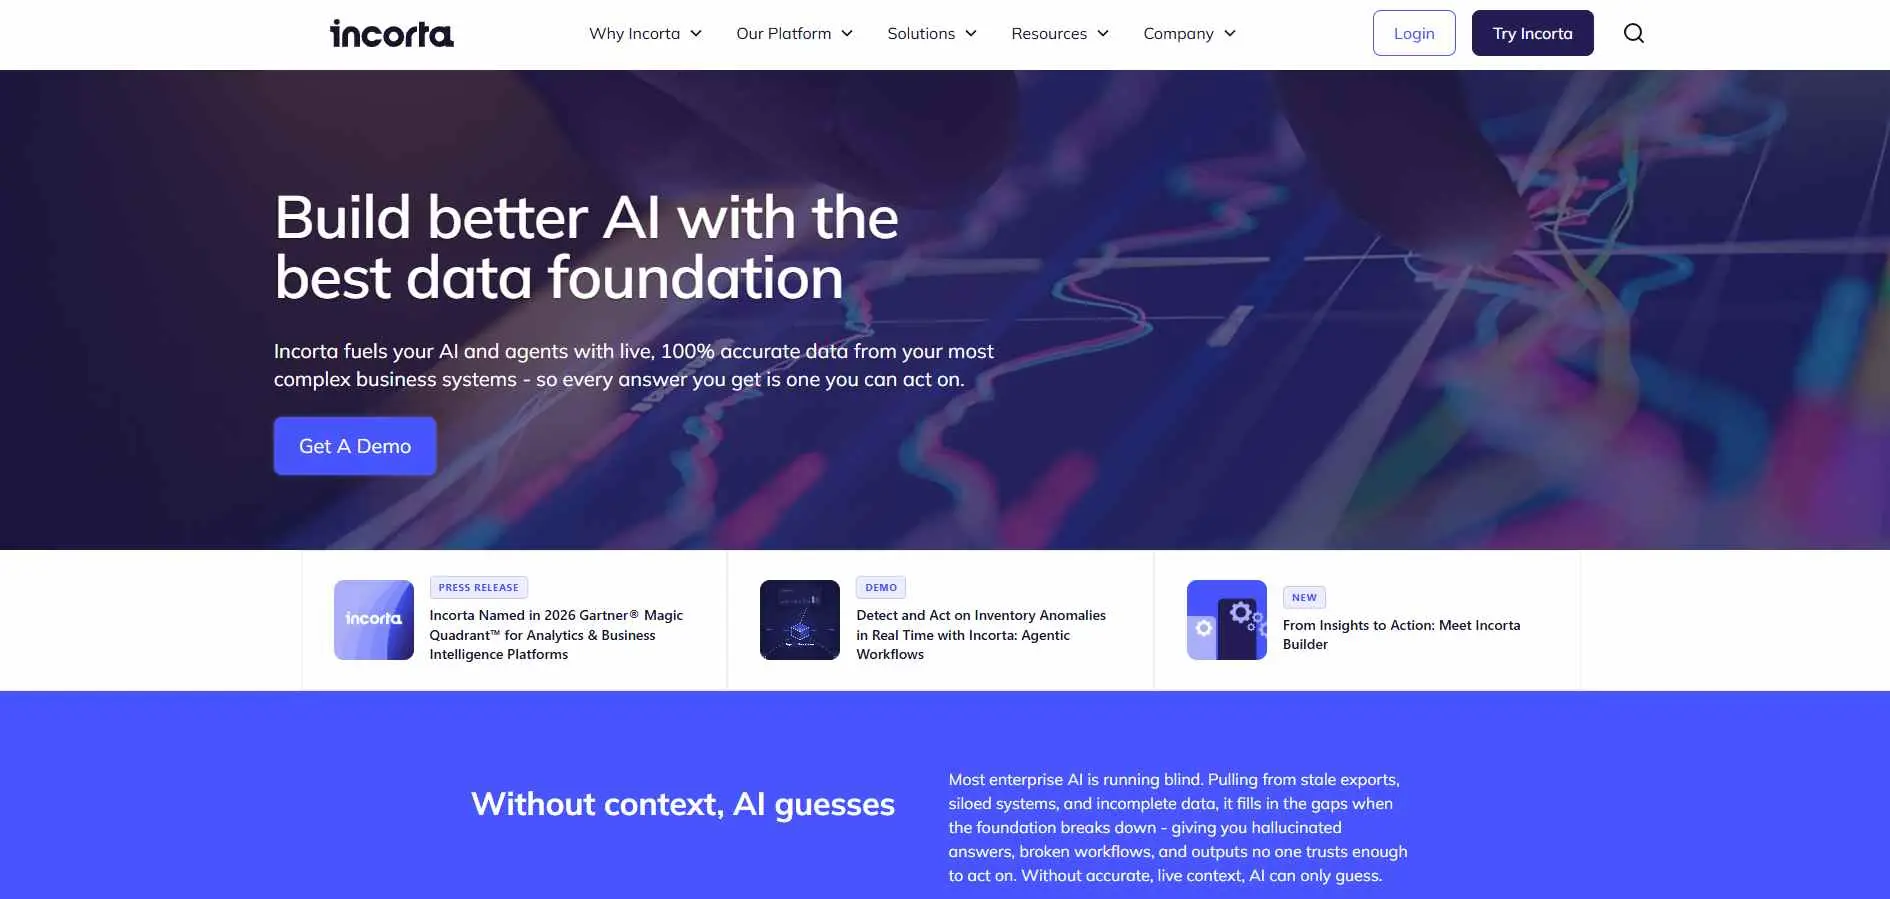
Incorta is a business intelligence platform built for real-time analytics. It combines data from multiple sources, delivering fast dashboards and detailed insights without complex data preparation.
Key features:
- direct querying of source systems with minimal ETL
- strong fit for SAP/Oracle environments
- handles complex joins at scale.
Best for: Enterprises running SAP or Oracle who want to skip warehouse buildout.
11. Databox - Best for marketing and small-business dashboards
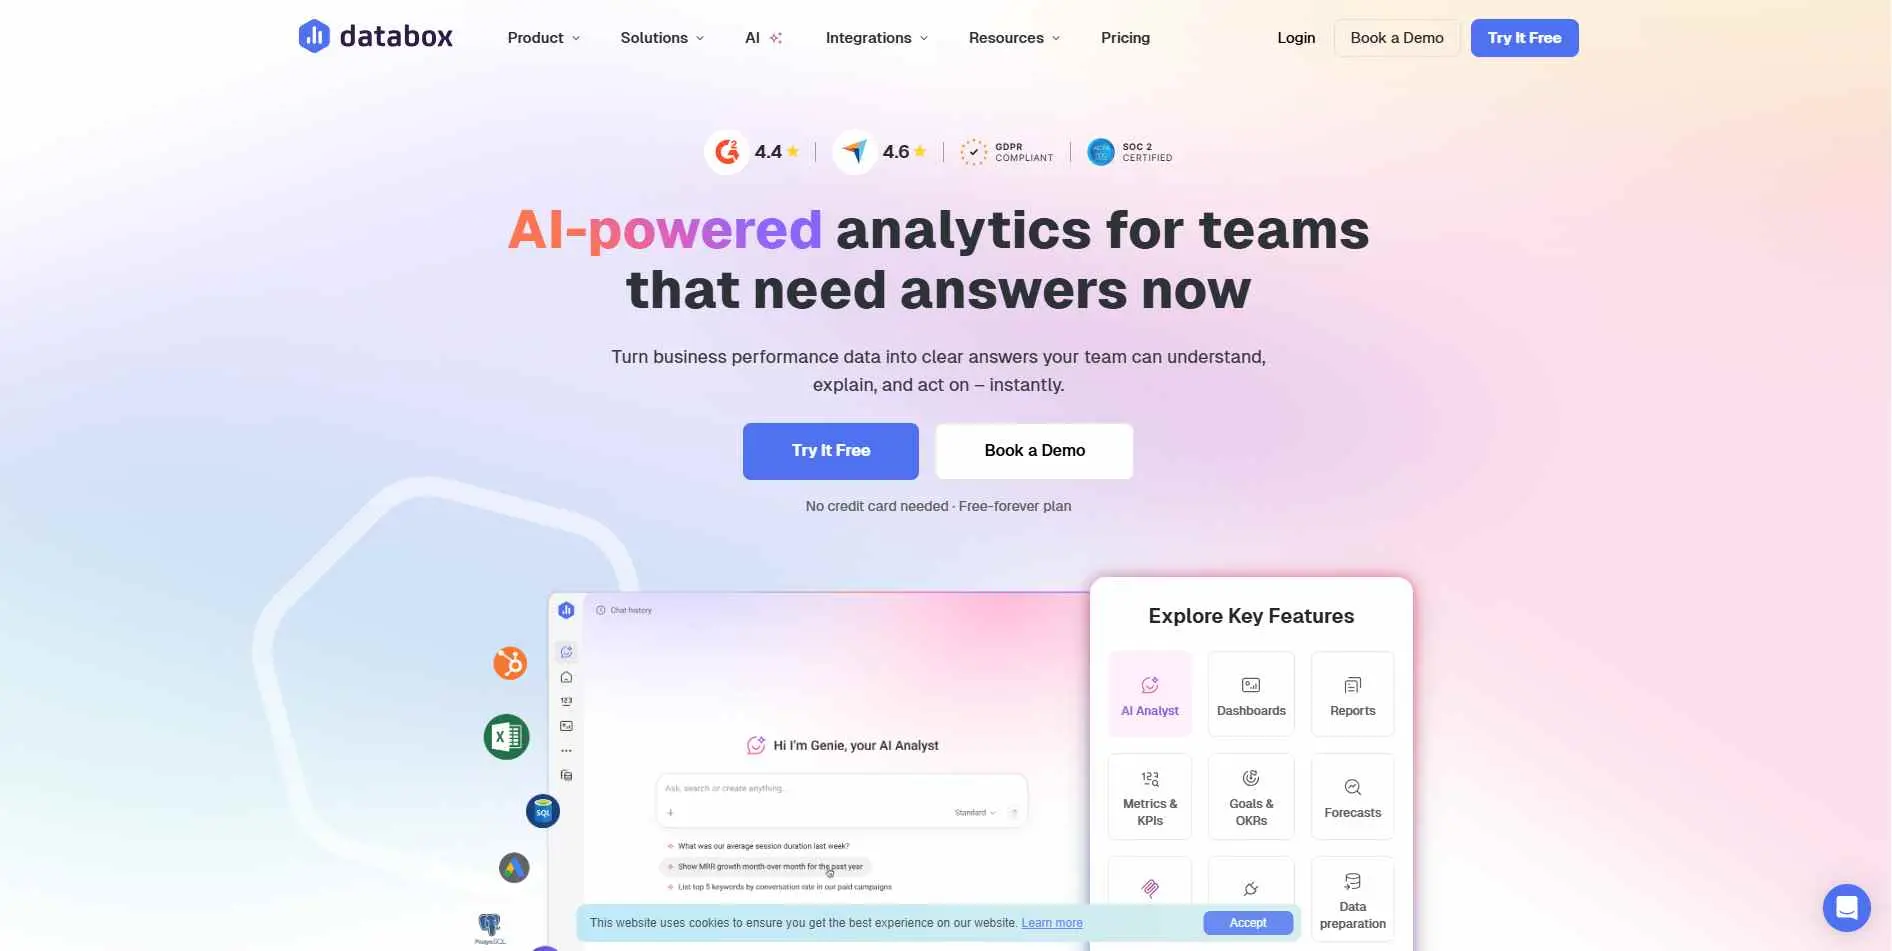
Databox is a business intelligence and reporting platform that gathers all your marketing, sales and business data in one single dashboard, helping teams track KPIs and performance in real time.
Key features:
- pre-built integrations (HubSpot, Google Analytics, Shopify)
- TV-mode dashboards for team visibility
- simple goal-tracking and alerts.
THE CATCH: shallow next to the enterprise tools on this list - great for a scoreboard, not deep exploratory analysis.
Best for: Small businesses and marketing teams wanting a live metrics dashboard.
What These Tools Get Right
Faster decisions. A dashboard that updates itself beats waiting on someone to build a report from scratch.
Less tribal knowledge. Metrics living in a shared dashboard instead of one analyst's head means fewer repeated questions.
Catching problems early. Near-real-time BI surfaces a dip in conversion or a spike in churn before the quarterly review does.
Scaling analysis without scaling headcount. Self-service tools like Metabase and Domo let non-analysts answer their own questions.
Where They Fall Short
This is the part most roundups skip.
Read-only by default. Tableau, Looker, Qlik Sense, and most tools above show you the data but won't let you act on it - write-back usually means a separate product bolted on.
Dataset and pricing ceilings. Power BI's Pro tier caps at 1 GB; Qlik Sense caps cloud storage at 500 GB. These limits rarely surface until a team already depends on the tool.
Steep curves hiding behind clean UIs. Spotfire, Looker's LookML, and Qlik's associative model all take real ramp-up time - the demo is never as fast as production use.
Fragmented tooling. Most companies run two or three BI tools at once because no single platform covers reporting, embedding, and write-back together. (If your BI stack feeds into conversion work, our CRO tools guide covers the analytics side of that specifically.)
⚠ Warning: a polished dashboard isn't proof of a healthy data pipeline. It only proves someone connected a source - not that the numbers are trustworthy.
How to Choose the Right BI Tool
Start with the use case, not the feature list. A marketing team wanting a live scoreboard needs Databox, not Databricks.
Decide read-only vs. write-back early. If people need to update records or trigger workflows from the dashboard, most tools here need add-ons for that.
Check where your data already lives. Teams on Databricks or Snowflake save real setup time staying in that ecosystem instead of duplicating data into a new warehouse.
Price against actual data volume, not the demo tier. Free and entry plans routinely cap datasets below what a growing team hits within a year.
✓ Tip: pilot two tools on the same dataset for two weeks. If the gap isn't obvious by then, the feature chart won't settle it either.
Where to Start
- Define whether the need is reporting, embedding, or write-back.
- Check where your data already sits - lakehouse, warehouse, spreadsheets, SaaS apps.
- Shortlist two or three tools and run the same dataset through each.
- Confirm pricing against real data volume, not the free tier.
Picking a BI tool is a bet on how your data infrastructure looks in two years, not just this quarter.