
 Table of Content
Data is a useful resource. It enables firms to see patterns, carry out assessments, make wise choices, and establish reasonable objectives. However, even with all the data necessary for success, a business might still fail if no one understands how to use it or comprehend it.
Many people in a company outside of the analytics team may perceive datasets as speaking a foreign language.
Data visualization can be useful in this situation. Professionals may take raw information and transform it into something simple to understand via data visualization.
The definition of data visualization, its significance, and a selection of some of the best tools for business professionals are provided below.
The basics of data visualization
Making a visual representation of the information in a dataset is the process of visual data.
Although there are countless ways to depict information, some of the more popular methods include:
- Graphs
- Diagrams
- Heatmap tools
- Infographics
Data is frequently simpler to grasp and derive insights from when it is represented visually. As a result, data visualization is a useful tool for increasing data accessibility within an organization.
As a result, individuals may feel more empowered to support their decisions with factual knowledge rather than on, leading to more data-driven organizational procedures.
It may be crucial in communicating with those outside of a company, such as the press, investors, government officials, and other stakeholders.
Modern business today places a premium on data visualization, and many companies are seeking people with these talents in addition to other data science competencies.

Data visualization tools
There are several tools that can be helpful if you want to represent your online business data visually.
Let’s see what tools there are at your disposal.
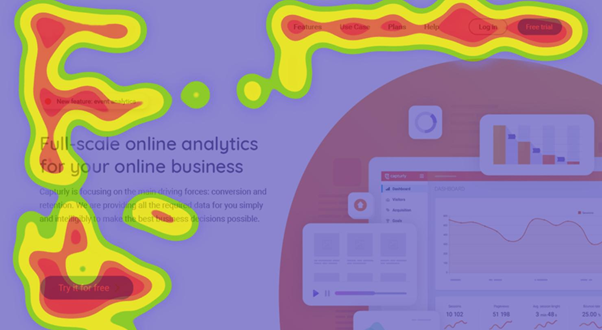
Heatmap tools
One of the most effective and well-liked visualization strategies is the usage of heatmap tools. It can help you assess the advantages and disadvantages of your website. Additionally, you may see how your website's visitors use it and which pages on it they frequently visit.
What is the underlying mechanism? Think of it as a thermal camera that measures temperature. This utility functions using the very same principle.
Cooler colors denote less popular portions of your website, while warmer hues highlight popular places. You are undoubtedly wondering why you should utilize this and why it is useful to you.
As an instance, you might be able to advertise in a more targeted area where your visitors will see it if you know which sub-pages they are more likely to visit. This will enable you to attract more customers to your goods or service.
Additionally, you may determine which areas of your website are not being used. Heatmap tools can help you improve these locations since they will highlight the parts of your website that are most popular with users.
Use these components in places where they aren't as effective. You may improve both the UX and usability of your website in this way.
As you can see, heatmap tools are practical for assessing your website's efficacy and visitor behavior. It could be a great option if you wish to optimize your website.
But what types of heatmap you can use for website checking?
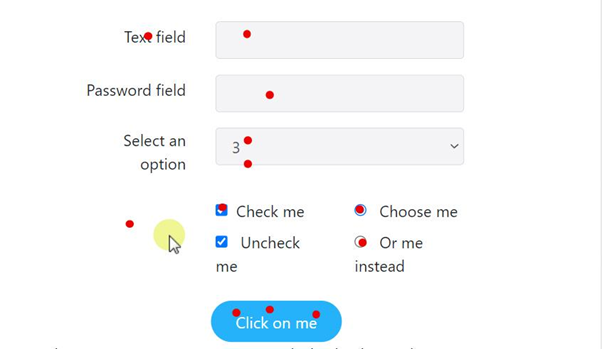
1. Click heatmap
The click heatmap is a fantastic tool to use to find out how visitors are interacting with your website. It enables you to observe which buttons receive the most clicks, views, and conversions, as well as which product subpages receive the most traffic.
You may use a click heatmap to determine which CTAs work best on your website and in your advertisements.
Because the creative components that worked well on your website will almost probably work well in your commercial, you should also take a closer look at certain design elements.
With the help of these data visualization tools, you may obtain lots of pertinent data.
2. Segment heatmap
You could find it helpful to use a segment heatmap to identify the main source of your traffic.
In light of this, if you're having problems keeping track of your purchases, you may use this information to assist you.
3. Scroll heatmap
Scroll heatmap is quite useful for blog interfaces because it let you place links to your content where they are most likely to be noticed.
You can view the size of the advertisements that are shown on your website by employing a scroll heatmap, which is another advantage. This will enable you to place advertisements in the busiest areas.
Session replay
A data visualization tool called session replay demonstrates how users interact with your website.
While a visitor is on your website, think about initiating a screen recording on their desktop or phone.
It reveals what people watch, where they click, and how long they spend on each piece of content.
As you can see, this information is crucial, especially if your goal is to increase the conversion rate of your website.
On the other side, what services do session replay analytics offer? What sort of stuff is it capable of viewing?
- Website usability
- Buttons
- Calls to Action
Of course, session replays can disclose much more information than these four, but for now, we'll concentrate on these four. Why?
We understand that your main goal is to increase your conversion rate. If you want to increase the number of your customers or subscribers, keep these four factors in mind while you do your session replay analysis.
Ways how data visualization boosts website performance
Develops strong value propositions
It is simple to tell a potential customer how great your services or products are, but it might be challenging for them to understand what you are saying.
The good news is that using data visualization as a marketing tactic can help you attract more customers to your establishment.
This furthers the process of converting website visitors into sales, hence enhancing the overall performance of the company.
As an example, if you have an mp4 compressor program on the web, you can track the visitor's behavior, the source of the visitors, or even the usage of your digital product.
Lead sites and social media platforms may both use data visualization. Through visualization, you can show customers how serious your company is and how the products and services you provide can meet their needs on a daily basis.
Boosts team motivation
The collective efforts of the team members have a major role in the overall success of a specific firm. Every member of your company's staff is always pleased to see the company advancing in its development.
Data visualization aids in determining the business's starting point and current course.
One method of determining the business's growth achievements is to visually present the recorded sales data. The team members are inspired to work more and take the company to new heights as a result, which inspires them.
An excellent method to empower your company team is to visualize your business activities.
Increases customer satisfaction
Customer satisfaction is the key to any successful business. In the commercial sector, data visualization is crucial for enhancing the customer experience.
In order to ensure that consumers are happy and that all of their demands are met, it is important to create a positive environment for your customers as well as to have a strong company team.
Users may filter, shape, and desegregate the data as needed using data visualization, which they can then utilize to make wise development decisions.
It is clear that companies using data visualization provide a fantastic consumer experience, which helps to explain their success.
Facilitates the process of making decisions
A number of management team decisions affect the outcome of a certain firm. However, the choices taken may have a favorable or bad effect on the company. This implies that before making a final choice, corporate executives must consider a number of factors.
Making decisions has become much easier because of data visualization. Using visual material, business executives may quickly assess the state of the market, simplifying the process of market analysis.
The performance of the overall firm can thus be influenced by decisions made by business management teams.
Conclusion
Data in its raw form and statistics power businesses. It is obvious that data visualization has a big influence on how firms develop and prosper.
Try to use different types of tools, such as combining a heatmap with session replay.
However, you need to come up with a better method of presenting your facts to the audience. You can meet all of your demands by using data visualization in your presentation.
This work is made simpler by several types of dashboards or data visualization tools.
We hope we can help.